Gulf of Alaska Waters Warmer Than NormalBy SHARICE WALKER
October 20, 2014
“It was like working in a bath tub out there,” said chief scientist Russell Hopcroft, a professor at the University of Alaska Fairbanks School of Fisheries and Ocean Sciences, “except for the high winds and 12-foot swell. This year was more than 1°F warmer than any other year we have studied.”
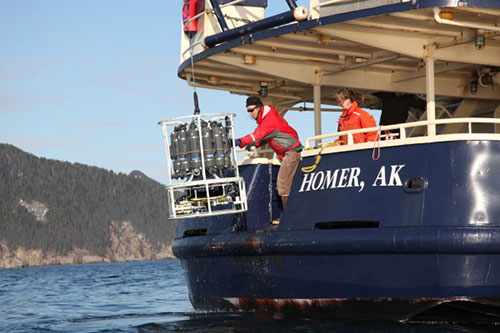
Researchers pull in a CTD — an instrument that collects high resolution temperature and salinity data throughout the water column. According to Hopcroft, warmer temperatures along the transect — known as the Seward Line — are partly a result of an unusual winter that left the Gulf’s offshore waters warmer than normal. A warm-water anomaly in the tropical Pacific Ocean may have added to the rise in temperatures. Other research teams in Alaska this summer have found warmer waters from Southeast Alaska through the Bering Sea, according to Hopcroft. Rising temperatures can have big consequences for marine life. Some cold-water fish, crab, plankton and other species experience challenges when water is too warm. Other species grow more quickly in warm water but burn more calories and therefore must find more food. During warm years like these, coastal currents may carry southern species northward. The university research team led by Hopcroft found unusually large numbers of warmer-water plankton species during their September 2014 surveys, in which they used two types of plankton nets and an instrument to collect temperature and salinity data at different depths. Months of laboratory work analyzing plankton samples will be required know the full extent of this invasion.
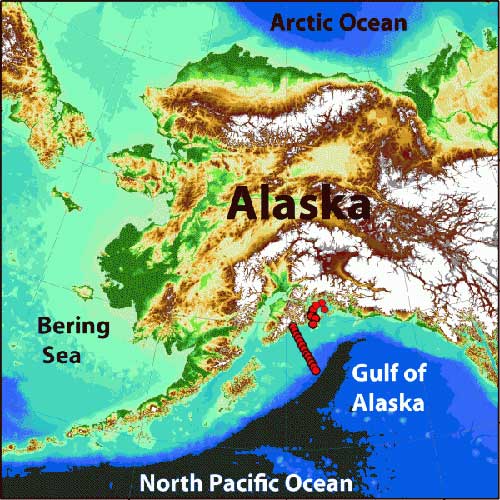
The Seward Line transect starts near the mouth of Resurrection Bay and extends into the Gulf of Alaska, capturing both coastal and offshore currents.
Other examples of ocean monitoring technologies currently in use include profiling drifters that help monitor temperature and salinity in the deep ocean beyond the continental shelf; satellites that track the development of these warm conditions at the ocean’s surface; fixed buoys suited with instruments; and biological and chemical samples taken from ships. Data repositories, like the Alaska Ocean Observing System online at www.aoos.org, help aggregate and integrate the data into maps for easy interpretation by researchers and managers. “Thanks to technological advances and the ability to coordinate monitoring devices at sea, scientists are better able to keep their fingers on the pulse of the ocean, and we’re able to share the information,” noted Molly McCammon, director of the Alaska Ocean Observing System. “New integration and visualization tools allow us to view the ocean in 4-D: two dimension space, depth and time,” she said.
SHARICE WALKER
|
||

