How Alaska wages have shifted in the last 25 years
October 12, 2015
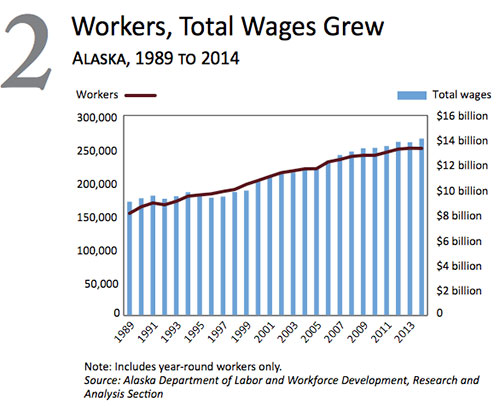
Wages have stagnated and inequality has grown even as a growing percentage of Americans earn a four-year college degree. For the first time in American history, rising worker productivity has not translated into higher wages. Such failures in national economic policy are not inevitable — they are a result of more regressive taxation, union-busting, education defunding, and outsourcing. The October issue of Alaska Economic Trends explains how earning patterns have shifted in the last 25 years. According to a report by Alaska Department of Labor Research Analyst Mali Abrahamson, the total amount earned has grown steadily over the past 25 years, but there have been shifts in the distribution of those earnings.
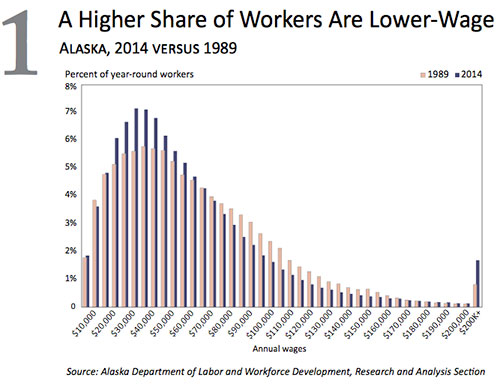
The percentage of year-round Alakska workers making relatively low wages — between $20,000 and $40,000 — increased from 28 percent in 1989 to 34 percent in 2014. However, the percentage of Alaskans making moderately high wages — between $70,000 and $150,000 — fell from 34 percent to 26 percent. For the small number of workers making more than $200,000 a year, the percentage more than doubled between 1989 and 2014, from 0.8 percent to 1.7 per- cent. That growth came mostly from upper manage- ment occupations in the oil and gas industry.
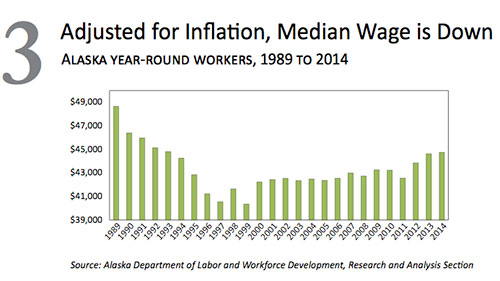
Related to the shift in wages, Alaska’s median wages is also lower now than it was 25 years ago, though it has been steadily rising since 1999. All wages in this article are adjusted for inflation and are in 2014 dollars. Abrahamson's report covers only year-round workers, or those who worked in Alaska in all four quarters of the year. Wages and worker counts include full-time and part-time employees and exclude federal civilian and military workers as well as the self-employed. It also only covers payroll workers, or those who earn a wage or salary. Business owners, including partners in a business who share profits but don’t receive a wage or salary, are excluded.
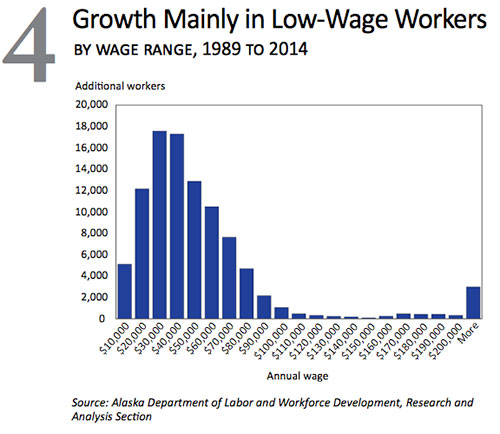
The median wage went down In 1989, Alaska’s median wage was $48,654, the highest over the 25-year period. The state’s economy changed as the service sector expanded in the early ‘90s, bringing in more lower-paying jobs in office administration, food service, and retail. State and local government workers’ wages also dropped significantly as Alaska emerged from the high-demand labor market of the 1970s and 1980s brought on by pipeline construction and the boom fueled by new oil revenue. By 1999, the median wage hit its lowest point at $40,350. It has gradually increased since then, to $44,750 by 2014. More workers with lower wages Two-thirds of the numerical growth in year-round workers since 1989 has been among those making less than $50,000 a year. There was little to no increase in the number of workers in the $90,000 to $200,000 range.
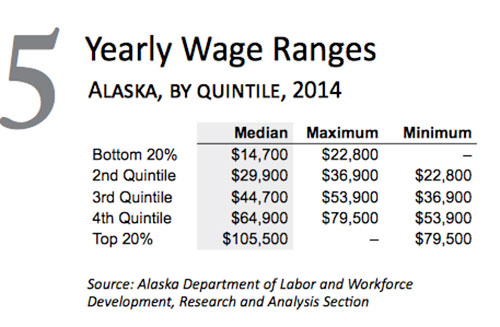
The high earners To help explain some of the shifts, the Alaska Department of Labor grouped workers into five wage categories and adjusted their earnings to 2014 dollars for comparison. In 2014, the top 20 percent earned 45 percent of Alaska’s total wages. The top 40 percent earned more than two-thirds. The top 1 percent earned 6.5 percent.
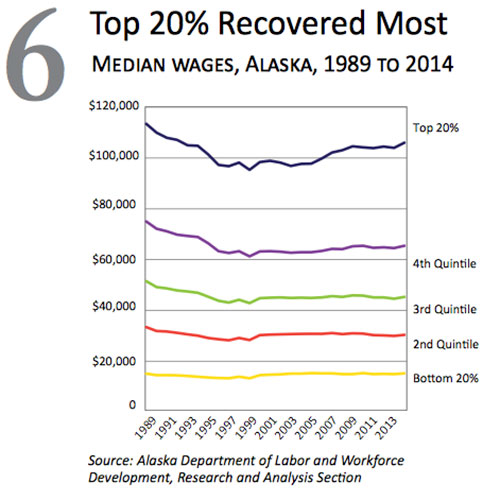
Median wages fell for all quintileses through 1999, but the top 20 percent’s earnings have recovered the most since. In this group, median wages fell by $18,000, or 16 percent, from 1989 to 1999. But by 2014, the median was down just $7,400 from 1989. The mean or average wage among the top earners grew, however, from $124,000 in 1989 to $128,000 in 2014. The reason the median went down but the aver- age went up for this group is that the number and per- centage of especially high earners grew, skewing the average upward. In 2014, more than 40 people earned more than $1 million, while in 1989 there were just a few. The low earners The lowest 20 percent of earners made less than 5 percent of total wages in 2014. Their wages varied the least over the 25-year period. This group’s 2014 median wage of $14,700 was about a hundred dol- lars less than it was in 1989. Although these were all year-round workers, many in the lowest bracket worked part-time.
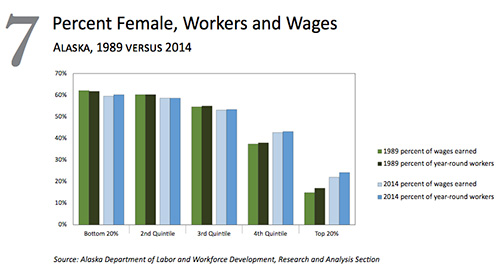
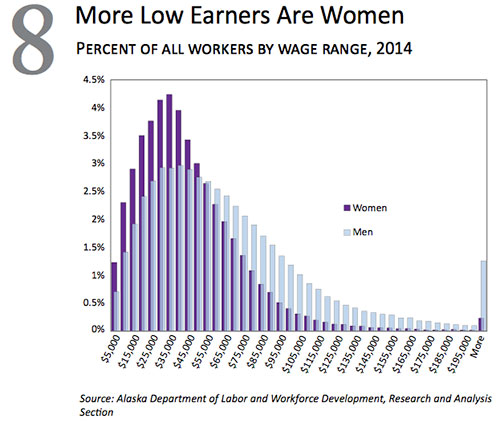
Those in the middle Wages for quintiles two through four fell considerably through 1999, then had ups and downs through 2014 but didn’t recover to 1989 levels. In 2014, the second-lowest earning group, group two, had a median wage that was $3,000 lower than it was in 1989. Group three’s wages were $6,250 lower, and group four’s were $9,600 lower. More women in low, high brackets In both 1989 and 2014, women were much more likely than men to earn low wages.
There were noticeable increases in women in the overall percentage of workers and wages in the top two quintiles, although in the highest quintile women still are just 24 percent of workers and and make 22 percent of that group's wages. In 2014, the ten lowest earning levels, from $5,000 to $50,000, all had higher percentages of women 0.5% than men, and the reverse is true at higher earning levels. The fact that women are more likely to work part-time explains some, but not all, of the difference.
Edited by Mary Kauffman, SitNews
Source of News:
|
||
